-
Recently Browsing 0 members
- No registered users viewing this page.
-
Forum Statistics
250.5k
Total Topics2.7m
Total Posts -
Member Statistics
342,877
Total Members8,960
Most Online
-
Who's Online 7 Members, 1 Anonymous, 672 Guests (See full list)
-
Latest Articles
-
Posts
-

By bryant1tristain · Posted
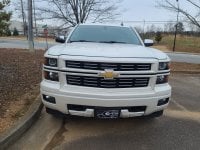
I just swapped from my rst led headlights to hc hid led lights. i will say they look good. but as i was driving it today i had a notification. saying right lamp malfunction. after turning the blinker off for a minute it went back to working normal. i will say i bought some cheap amazon ones for 270 each and the connector just didnt feel like it clipped in well. just wondering if someone else has went from standard led lights to hc leds lights and had any issues. -

-
.thumb.JPG.2c573de60d3a3a4407c7d92298db46dd.JPG)
By Grumpy Bear · Posted
Another take is that COVID19 interruptions reduced inventory (supply chain issues) and with intent that level has been maintained? 🤔 -
 Well, no, it's not much considering the curb appeal alone. I've got an appointment for Friday to have the Coopers put on. I also found out Discount Tire gives me $10/tire off for being an AAA member. I'm not doing this to make a bunch of money, it's just for fun. But eventually I'll need to watch my costs. At some point it's just a 95 Blazer valued per pound, like the rest of them. But a slightly nicer, more "fun" looking tire could cinch a sale and win a few extra bucks too. I don't remember if I mentioned what I paid...$1500. I'd be lucky to get $3500-$4000 out of it and that's with $2100 in parts and tires, not counting $280 for taxes and registration. I really don't stand to make anything. The new O2 seems to be working well. Didn't help the exhaust smell, though. Thankfully the seriously messed up downstream O2 sensor was just messed up. Threads in the bung were just fine, and a new one screwed right in (with extra anti-seize! -to be nice to the next guy).
 -

By StingerZ16 · Posted
$80 for curb appeal and a sale?
-
-
GM-Trucks.com Clubs
-

Black Truck Club
Open Club · 612 members
-
White Truck Club
Open Club · 380 members
-

Canadian Owners Club
Open Club · 282 members
-

Red Truck Club
Open Club · 157 members
-
diesel 3.0
Open Club · 281 members
-

Texas Owner's Group
Open Club · 371 members
-
NorthSky Blue Club
Open Club · 118 members
-

Midwest Owner's Group
Open Club · 213 members
-
2015 Custom Sport Club
Open Club · 5 members
-

GM Snow Plowing Club HD
Closed Club · 14 members
-
-
Popular Contributors
-

Recommended Posts
Create an account or sign in to comment
You need to be a member in order to leave a comment
Create an account
Sign up for a new account in our community. It's easy!
Register a new accountSign in
Already have an account? Sign in here.
Sign In Now