-
Recently Browsing 0 members
- No registered users viewing this page.
-
Forum Statistics
250.4k
Total Topics2.7m
Total Posts -
Member Statistics
342,866
Total Members8,960
Most Online
-
Who's Online 1 Member, 0 Anonymous, 491 Guests (See full list)
-
Latest Articles
-
Posts
-
 Late reply, but yes—it works on the SLT trim. Compatibility comes down to the plastic shroud shape behind your mirror, not the trim badge itself. On the SLT with auto-dimming, it uses a plug-and-play Y-harness off the mirror/rain sensor power, so no need to run wires down to the OBD port. If anyone's ever unsure about fitment, just drop a photo of your mirror housing and we can double-check it. Appreciate the detailed feedback on the install! On the windshield glare—we actually took feedback like yours and developed a dedicated CPL (polarizer) filter to cut down dash reflections on sunny days. If you're still running the cam, shoot me a DM. I'd be happy to send a CPL filter over for you to test out—no charge.
 -

-
-
 Yes, every time the developer updates his code, you must recompile. I will private message you with the latest because it changes pretty much with every version.
 -
.thumb.JPG.2c573de60d3a3a4407c7d92298db46dd.JPG)
By Grumpy Bear · Posted
After I wrote that reply I went for a ride. 85 F out. So trans started at 85 F and it shifted the same as it did an hour latter at 168 F. I've never actually recorded the to cold to shift point but it is under 32 F before they start hanging on to a lower gear or leaving the converter unlocked. Both intended to heat fluid. Yes, brake or bake. Absolutely. Your welcome. True research ended decades ago. Field trials are still in play. There is a thing called oxidation onset temperature. This is the heat related oxidation not the O2 exposure kind. For mineral oil that starts at 140 F. So what happens after 140 F? Each 20 F cuts fluid life in half! Does using a Full Synthetic improve that? Yes! By how much? Depends on the base oil type and a few other factors. But enough to notice. Some esters are even higher. There are even synergies between types the will raise it higher than any one component is alone. Then there is "Hindered" oils. Antioxidant additives. Hindered Polyol Esters can sit at 500 F for years in a turbine. When a blender brags his oil will 'take 500 F" in service he doesn't specify for how long. Water will dance on a 500 F hot plate for several seconds. @newdude put up a chart showing the relationship between fluid temperature and it's life in an automatic transmission. Here's a version of that chart for Group III based oils. These temperatures are those in the pan as observed as 'normal'. that is you drive as you do for as long as you do under what load you ask of it and whatever that temperature is this graph applies to. Flash temperatures of a few minutes isn't what his means. Note that fluids held at a constant 240 F have a service life of only 20K miles. 220 F explains the factory exchange limit, eh? My equipment I keep under 180 F and I'm good if the cooler will hold it as low as 140 F. But that's me.
-
-
GM-Trucks.com Clubs
-

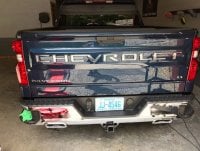
Black Truck Club
Open Club · 612 members
-
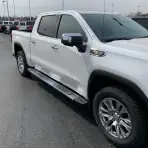
White Truck Club
Open Club · 380 members
-

Canadian Owners Club
Open Club · 282 members
-

Red Truck Club
Open Club · 157 members
-
diesel 3.0
Open Club · 281 members
-

Texas Owner's Group
Open Club · 371 members
-
NorthSky Blue Club
Open Club · 118 members
-

Midwest Owner's Group
Open Club · 213 members
-
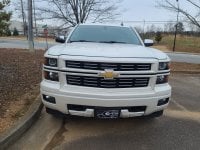
2015 Custom Sport Club
Open Club · 5 members
-
GM Snow Plowing Club HD
Closed Club · 14 members
-
-
Popular Contributors
-
Recommended Posts